Intoduction to GIS - GIS4043

Showing posts with label Land Boundary Information System (LABINS). Show all posts

Saturday, March 11, 2017

Data Search - Mid Term Lab

Week 7 & 8 – Data Search

For this week’s lab assignment, we were each given and a specific county in the state of Florida. I was given Liberty County.  We needed to search for three different types of data for the county.  Vector data which can be cities & towns; publicly owned land such as parks; and lakes, rivers, and major roads.  Environmental data such invasive plants, strategic habitat areas and land cover. We also needed to show two types of Raster data aerial photography, one of Digital Orthographic Quarter Quadrangle (DOQQ), and one of Digital Elevation Model (DEM).

When I first started this lab assignment I research to find out more about the county. Assorted websites showed that Liberty County is the least populous county in Florida.  As of the 2010 US Census the population was 8,365.  A large part of the Apalachicola National Forest resides in the county.

This was not an easy assignment. The data had to be gathered from multiple locations such as; LABINS, FGDL, FNAL and USGS. You also had to re-project the data to a standard projection such as NAD 1983 – 2011 State Plane Florida. In addition, the data had to be shown in such a manner on your maps that will make sense to your audience.


The tree maps below show the information for Liberty County, Florida, in the three data forms chosen: Vector, Environmental and Raster.


Thursday, February 23, 2017

Introduction to Projections - Part 2

Week 5 – Projections Part 2


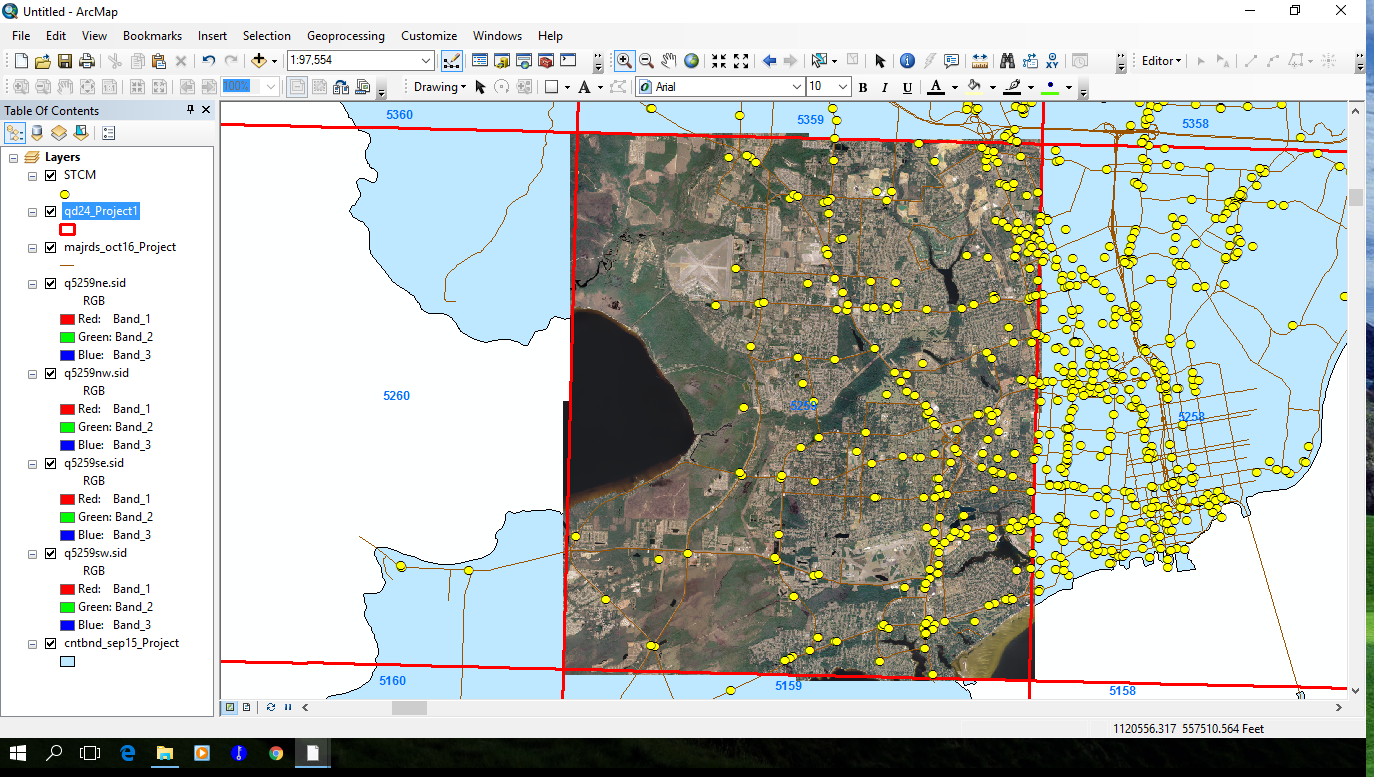
For this week’s assignment, we continued working with map projections in ArcMap. In addition, we also downloaded shapefile and aerial images from different websites. Land Boundary Information System (LABINS) and Florida Geographic Data Library (FGDL). We also had to create an Excel spreadsheet with Latitudes and Longitudes in Degrees, Minutes, and Seconds. After that we had to format them in Excel, and then convert the information to Decimal Degrees and format in Excel once again. 

Using some of the data we downloaded, we had to re-project the data to the coordinate system that we were using. The other data we had to define the projection so it lineup correctly with the other information.

For the Excel spreadsheet we had to convert the Latitudes and Longitudes from Degrees, Minutes, and Seconds, to Decimal Degrees.  Then you were able to add the spreadsheet date to ArcMap to give you point features for the locations. 

This was a long lab assignment but a very good one. This has helped me immensely to understand in depth, about projections and how to use them.